
Post Date: November 09, 2019
Last Updated: November 06, 2026
Introduction
Debugging is an essential part of web application development. While developing applications using the CodeIgniter PHP framework, developers may encounter various errors related to variables, database queries, controllers, models, AJAX requests, and application logic.
Identifying and fixing these issues can sometimes be challenging, especially when an application does not produce the expected output.
There are several CodeIgniter debugging techniques that developers can use to identify and troubleshoot application errors. PHP functions such as echo, print_r(), and var_dump() help display variable values directly in the browser, while the CodeIgniter log_message() function records debugging information in log files.
In this tutorial, we will explain how to debug in CodeIgniter using different PHP debugging functions, how to configure application logging, and how to debug AJAX requests in CodeIgniter with practical examples.
Whether you are a beginner or an experienced PHP developer, these PHP debugging techniques will help you identify errors and troubleshoot CodeIgniter applications more efficiently.
1. Different Methods to Debug in CodeIgniter
There are several ways to debug PHP applications developed using CodeIgniter. The most commonly used debugging methods include:
echoprint_r()var_dump()log_message()
These functions help developers inspect variable values, check application execution, and identify problems in controllers and models.
Let’s understand each method with practical examples.
1.1 echo()
The echo statement is used to display strings, numbers, and variable values directly in the browser.
It is one of the simplest PHP debugging techniques for checking whether a variable contains the expected value.
Example:
Output:

You can also display multiple variable values using echo.
$name = "John";
$age = 25;

echo "Name: " . $name;
echo "<br>";
echo "Age: " . $age;
Output:
Name: John
Age: 25
When to use echo():
- To check simple variable values.
- To verify whether a particular section of code is executing.
- To display temporary debugging messages.
- To check values received from forms.
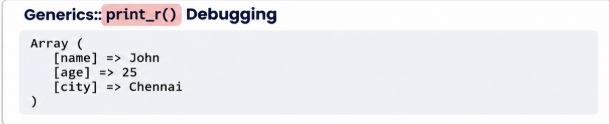
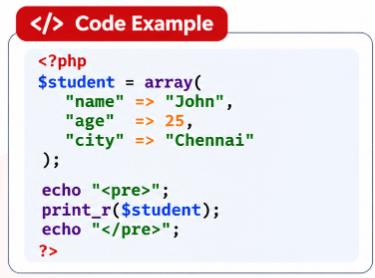
1.2 print_r()
The print_r() function displays information about a variable in a human-readable format.
It is especially useful when working with arrays and objects because it makes their structure and values easier to understand.
Example:
Output:
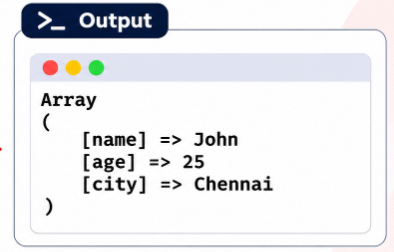
The HTML <pre> tag preserves the formatting and makes array output easier to read in the browser.
When to use print_r():
- To inspect array values.
- To check database query results.
- To verify data passed between controllers and models.
- To inspect API responses.
1.3 var_dump()
The var_dump() function displays detailed information about a variable, including its data type, value, and size.
Unlike print_r(), it provides additional details that help developers identify incorrect data types and unexpected values.
Example:
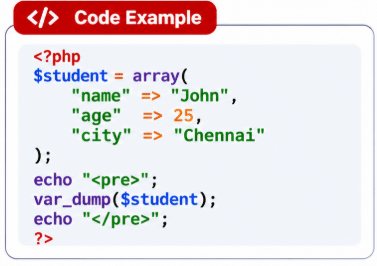
Output:
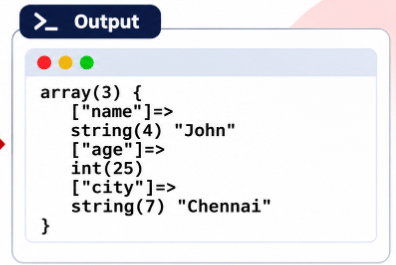
From the output, you can identify:
- The variable is an array.
- The array contains three elements.
- The name value is a string.
- The age value is an integer.
- The city value is a string.
Difference between print_r() and var_dump():
| print_r() | var_dump() |
|---|---|
| Displays readable variable information. | Displays detailed variable information. |
| Useful for inspecting arrays and objects. | Useful for inspecting data types and values. |
| Does not clearly show data types. | Shows data types and string lengths. |
1.4 log_message()
The log_message() function is provided by CodeIgniter to write debugging information, errors, and application messages into log files.
Unlike echo, print_r(), and var_dump(), the log_message() function does not display debugging output directly in the browser.
Instead, it records messages in the application’s log directory.
This method is useful when debugging production applications because developers can inspect application activity without displaying internal information to website visitors.
Syntax:

Common message types include:
errordebuginfo
Example:
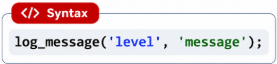
Before using this function, you need to enable logging in the CodeIgniter configuration file.
2. How to Enable log_message() in CodeIgniter
By default, CodeIgniter logging may be disabled. To generate application log files, you need to configure the logging threshold.
Configuration file:
application/config/config.php
Find the following configuration:
$config['log_threshold'] = 0;
Change the value according to your debugging requirements.
Available log levels
| Log Level | Description |
|---|---|
| 0 | Disables logging. |
| 1 | Records error messages, including PHP errors. |
| 2 | Records error and debug messages. |
| 3 | Records error, debug, and informational messages. |
| 4 | Records all messages. |
For example, to enable debugging messages, configure:
$config['log_threshold'] = 2;
Example of log_message()
Add the following code inside your controller or model:
log_message('debug', 'Debugging enabled');
Expected output in the log file:
DEBUG - 2019-11-08 15:41:48 --> Debugging enabled
The message will be recorded in the CodeIgniter application log file.
Where are CodeIgniter log files stored?
By default, CodeIgniter 3 stores log files inside:
application/logs/
You can navigate to the directory using the following Linux command:
cd application/logs/
List the available log files:
ls -lh
To monitor a specific log file:
tail -f log-2019-11-08.php
Replace the filename with the actual log file generated by your application.
Make sure the logs directory has the correct write permissions for your web server.
Note: Avoid setting the logging threshold to 4 permanently in production because it can generate a large number of log entries.
3. How to Debug Using var_dump() in CodeIgniter Controller and Model
In CodeIgniter, controllers handle incoming requests, while models handle database-related operations.
Sometimes, the data received by the controller or returned by the model may not be what you expect.
You can use echo, print_r(), and var_dump() inside controller and model files to inspect variable values.
Example: Debugging in a Controller
Suppose you are receiving a student ID from a frontend form.
You can inspect the received value using var_dump().
Controller example:
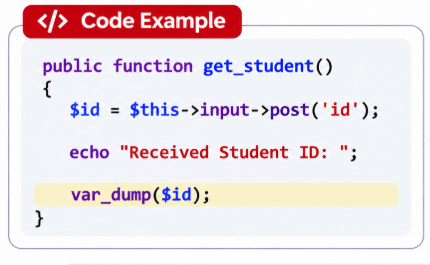
This helps you verify whether the controller receives the expected POST value.
Example: Debugging in a Model
You can also inspect database query results inside your model.
Model example:
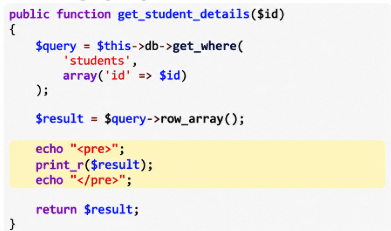
This helps you check whether the database query returns the expected student details.
Important: Temporary debugging output can interfere with normal controller responses and AJAX JSON responses. Remove debugging statements after troubleshooting.
4. How to Debug AJAX Requests in CodeIgniter
AJAX is commonly used in web applications to send requests from the frontend to the backend without reloading the entire webpage.
In CodeIgniter applications, AJAX requests communicate with controller methods, which may call models to perform database operations.
Sometimes, an AJAX request may execute successfully, but the expected response may not appear on the frontend.
To identify the issue, developers can inspect the AJAX response using JavaScript debugging methods.
Example: AJAX Request
Consider the following jQuery AJAX code:
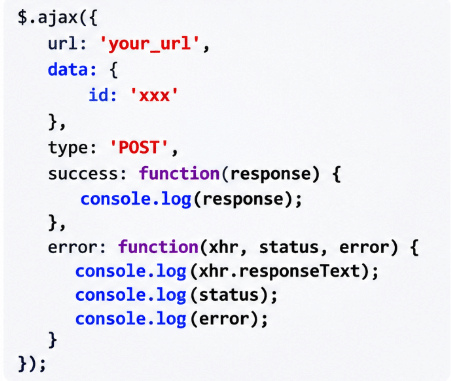
How does this work?
- The frontend sends an AJAX request to the CodeIgniter application.
- The controller receives the request.
- The controller processes the submitted data.
- The model performs database operations if required.
- The controller returns the response.
- The AJAX success callback displays the response in the browser console.
If the request fails, the error callback helps identify the issue.
Displaying AJAX Response in the Browser
If you want to display the response directly on the webpage for temporary debugging, you can use:
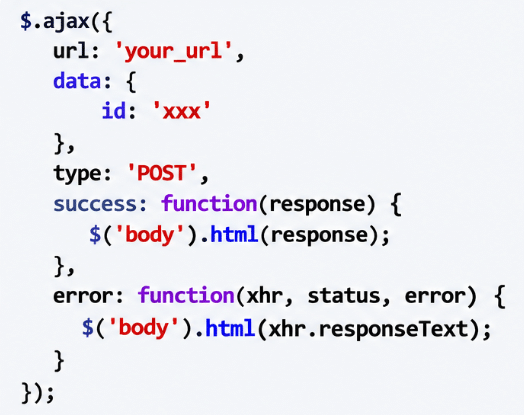
This allows you to inspect output generated by the controller or model.
However, replacing the entire webpage is suitable only for temporary debugging. A better approach is to use console.log() or display the response inside a dedicated HTML element.
5. Debugging AJAX Requests Using Browser Developer Tools
Browser Developer Tools provide additional information that helps developers identify frontend and backend communication issues.
You can open Developer Tools in Google Chrome by pressing:
F12
Alternatively, use:
Ctrl + Shift + I
Check the following tabs:
5.1 Console
Use the Console tab to identify JavaScript errors and inspect AJAX responses.
console.log(response);
This helps you verify the data returned by the CodeIgniter controller.
5.2 Network
The Network tab displays all HTTP requests made by the browser.
You can inspect:
- Request URL.
- HTTP status code.
- Request method (GET or POST).
- Submitted form data.
- Response content.
- Request duration.
5.3 Response
Select the AJAX request in the Network tab and open the Response section to inspect the actual data returned by the CodeIgniter controller.
This is particularly useful when an AJAX request returns an unexpected response or a PHP error.
6. Common CodeIgniter Debugging Issues and Solutions
Here are some common problems developers may encounter while debugging CodeIgniter applications.
Issue 1: log_message() Is Not Generating Log Files
Possible reasons:
- Logging is disabled.
- Incorrect log threshold.
- Logs directory does not have write permissions.
- Invalid log path configuration.
Solution:
Check the following configuration:
$config['log_threshold'] = 2;
Also verify that the logs directory has the correct write permissions.
Issue 2: var_dump() Is Not Displaying Expected Values
Possible reasons:
- The variable is empty or NULL.
- The controller method is not executing.
- The request is not reaching the expected controller.
- AJAX is returning a different response.
Solution:
Check the variable value and inspect the request using browser Developer Tools.
var_dump($this->input->post());
Issue 3: AJAX Request Is Not Working
Possible reasons:
- Incorrect AJAX URL.
- Incorrect HTTP method.
- Missing request parameters.
- PHP errors in the controller.
- Server-side errors.
Solution:
Inspect the Network and Console tabs in the browser.
You can also log the received request data:
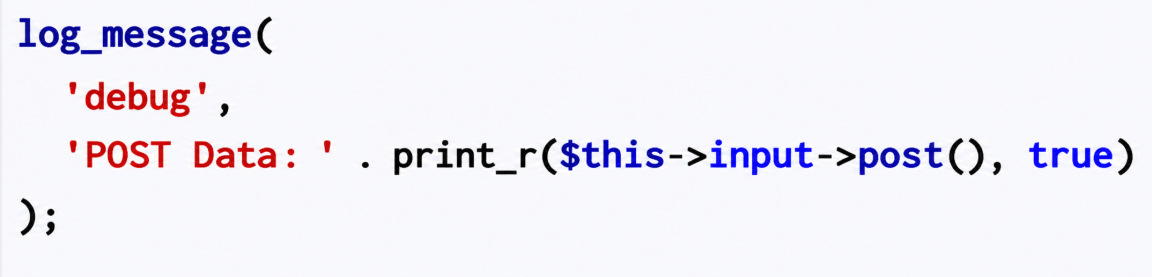
Issue 4: Database Query Is Not Returning Expected Results
Possible reasons:
- Incorrect table name.
- Incorrect column name.
- Invalid query conditions.
- Missing database records.
Solution:
Use CodeIgniter’s database debugging methods and inspect the query result.
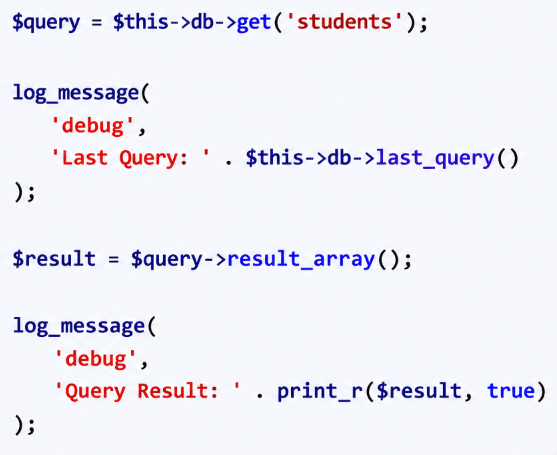
This helps you inspect both the executed SQL query and the returned data.
7. Best Practices for Debugging in CodeIgniter
Following proper debugging practices helps developers identify errors efficiently and maintain application security.
- Use
echofor quickly checking simple variable values. - Use
print_r()to inspect arrays and objects. - Use
var_dump()to identify variable data types and values. - Use
log_message()to record debugging information. - Use browser Developer Tools to inspect AJAX requests.
- Check application log files when investigating PHP errors.
- Verify database queries and returned results.
- Avoid displaying sensitive information in the browser.
- Remove temporary debugging statements before deploying to production.
- Keep production logging enabled at an appropriate level.
Conclusion
Debugging is an essential part of developing and maintaining CodeIgniter applications. PHP functions such as echo, print_r(), and var_dump() help developers inspect variable values, while CodeIgniter’s log_message() function provides a convenient way to record application errors and debugging information.
By following these CodeIgniter debugging techniques and using browser Developer Tools, developers can identify problems in controllers, models, database queries, and AJAX requests more efficiently.
Understanding these methods can save development time and make troubleshooting easier when working on PHP applications.
Thank you for visiting Pheonix Solutions. We hope this tutorial helps you understand how to debug in CodeIgniter. If you find this article useful, share it with your friends and fellow developers!
Frequently Asked Questions (FAQs)
1. How do I debug in CodeIgniter?
You can debug CodeIgniter applications using PHP functions such as echo, print_r(), and var_dump(). You can also use CodeIgniter’s log_message() function to record debugging information in application log files.
2. How do I enable debugging in CodeIgniter 3?
Open application/config/config.php and configure $config['log_threshold'] to 2 or higher to enable debug and additional logging messages.
3. Where are CodeIgniter log files stored?
By default, CodeIgniter 3 stores log files inside the application/logs/ directory.
Official Links
- CodeIgniter Official Documentation
- CodeIgniter 3 Database Configuration
- CodeIgniter 3 Connecting to Multiple Databases
- CodeIgniter 4 User Guide
Related Articles
How to add Google ReCAPTCHA in PHP Codeigniter
Need Assistance with CodeIgniter Development?
Configuring multiple database connections requires careful handling of credentials, database permissions, query execution, and application architecture. Pheonix Solutions can assist with PHP application development, CodeIgniter integration, database configuration, performance optimization, and troubleshooting.
If you need assistance implementing multiple database connections or maintaining your CodeIgniter application, contact Pheonix Solutions to discuss your requirements.